How does nitrogen fertilizer affect water quality? The answer begins in farm soil, but it often ends downstream. Rain can dissolve unused nitrate and carry it into ditches, streams, aquifers, and reservoirs. These invisible flows may increase drinking-water treatment costs and ecological stress.
The U.S. Environmental Protection Agency identifies nutrient pollution as one of America’s most widespread and costly environmental problems. The U.S. Geological Survey also reports that agriculture remains a major source of nitrogen delivered to many rivers and coastal waters. NOAA’s 2024 Gulf of Mexico assessment measured a hypoxic zone covering about 5,827 square miles. It was larger than the recent five-year average. Nitrogen is not the only cause, but fertilizer losses can intensify the chain.
Dr. Nancy Rabalais, a leading hypoxia researcher, has described the Gulf dead zone as “a symptom of a larger problem.” Her observation matters because poor water quality rarely comes from one field or one storm. Nitrate can stimulate dense algal growth. Decomposition then consumes dissolved oxygen. Fish and shellfish may flee or die.
Some effects are easy to see. Others remain underground for years. A clear stream may still contain unsafe nitrate levels. That is an uncomfortable limitation in public monitoring. This guide examines ten ways nitrogen fertilizer affects water quality, from algal blooms and oxygen depletion to groundwater contamination and drinking-water risks. The evidence is strong, but local results vary with soil, weather, application timing, drainage, and farm management.
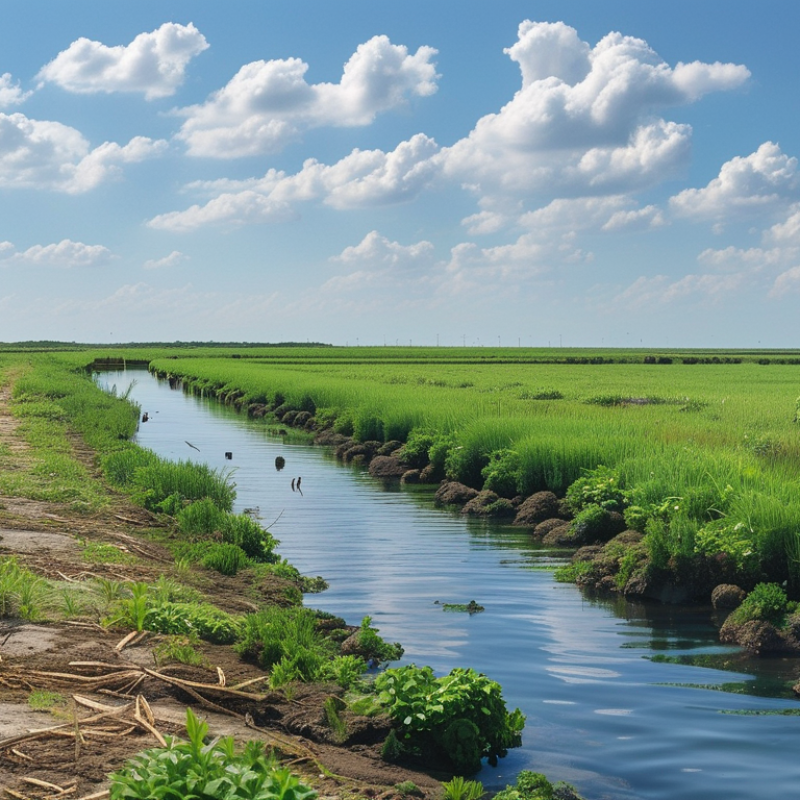
Top 10 Ways Nitrogen Fertilizer Affects Water Quality
Nitrogen fertilizer enters farms through several sources. Synthetic products commonly contain urea, ammonium, or nitrate. Manure, compost, and decomposing crop residues also release nitrogen. Rainfall, irrigation, and soil microbes then change its form.
Nitrate dissolves easily and moves downward through porous soil. This process, called leaching, can carry nitrogen into groundwater. Sandy fields and shallow water tables face greater risks. In one practical example, a heavy spring rain can move recently applied nitrate toward drainage tiles within hours. Ammonium usually binds to soil particles, but microbes can convert it into nitrate. Urea may also release ammonia gas before entering the soil.
Water movement determines where nitrogen finally appears. Surface runoff carries dissolved nitrate and soil particles into ditches, streams, and reservoirs. Tile drainage can deliver nitrate directly to nearby rivers with little filtration. Flooding may disturb sediment and release stored nitrogen. Warm, oxygen-poor water can then support excessive algae growth, lowering oxygen for fish.
The pathway is not always obvious. Field measurements can miss short pollution pulses after storms. Application timing, soil texture, crop uptake, and weather all change the result. Better testing combines soil samples, well checks, drainage monitoring, and rainfall records. That approach is more reliable than judging water quality from one sample.
Nitrogen fertilizer can affect water quality through nitrate leaching, surface runoff, ammonia volatilization, drainage discharge, algal blooms, dissolved oxygen depletion, drinking-water contamination, groundwater pollution, coastal hypoxia, and changes in aquatic ecosystem balance.
The chart compares the standard nitrogen content of common fertilizer forms. Higher nitrogen concentration does not automatically mean greater pollution, but soluble nitrogen forms can create a larger potential nitrogen load when application exceeds crop uptake or rainfall and irrigation move nitrogen into water systems. Values are standard fertilizer-grade percentages and may vary by formulation.
Nitrogen fertilizer can improve crop growth, but excess nitrate does not stay where plants need it. After heavy rain or irrigation, nitrate dissolves easily and moves below the root zone. Sandy soils allow faster movement; clay soils may slow water, but they do not guarantee protection. In shallow wells, this pathway can create a quiet problem. Water may look clear, smell normal, and still contain elevated nitrate. The danger is invisible.
Reliable assessment combines fertilizer records, soil tests, rainfall data, and repeated well sampling. Samples should come from the same locations and reach qualified laboratories using recognized methods. A single result can mislead. Seasonal changes matter. Testing after wet periods may reveal contamination that dry-season sampling misses. High nitrate is a recognized drinking-water concern, especially for infants. Farmers can reduce losses by matching nitrogen rates to crop demand, splitting applications, and avoiding spreading before storms. Cover crops and deeper-rooted vegetation may capture leftover nitrogen, although results vary with weather and planting dates. Buffer zones near wells deserve special care, yet distance alone cannot stop movement through permeable soil. Household well owners should record test dates and consult local water professionals when nitrate rises. The best plan may still fail during unusual rainfall. Continued monitoring remains necessary.
Nitrogen fertilizer can nourish crops, but excess nitrogen often travels beyond the field. Rain washes nitrate from bare soil into ditches, streams, and ponds. Tile drainage can move dissolved nitrate even faster. This affects water quality in several ways: higher nitrate levels, cloudy water, unpleasant odors, and increased treatment costs. Wells near heavily fertilized land may also show rising nitrate concentrations.
The larger concern is nutrient runoff. Nitrogen feeds algae, causing green surface scums and harmful algal blooms. Some algae release toxins that threaten pets, wildlife, and drinking-water supplies. When algae die, bacteria consume oxygen while decomposing them. Oxygen levels then fall, creating hypoxic water where fish and aquatic insects struggle to survive. Eutrophication can also reduce plant diversity, damage habitats, and change food webs. The water may look calm.
In field monitoring, the worst losses often follow intense rain after fertilizer application. A sample taken upstream may appear clean, while water downstream carries a sharp nitrate increase. Timing, soil texture, slope, and fertilizer rate all matter. Cover crops, buffer strips, careful application, and soil testing can reduce these impacts. Yet these measures are not perfect. Buffer vegetation may fail during extreme storms, and soil tests cannot predict every runoff event. This uncertainty deserves more attention from farmers, regulators, and water managers.
Top 10 Ways Nitrogen Fertilizer Affects Water Quality
Nitrogen fertilizer can move quickly from fields into ditches, rivers, and groundwater. Its ten major effects include nitrate pollution, algal blooms, toxic algae, cloudy water, oxygen depletion, fish kills, habitat loss, food-web disruption, drinking-water risks, and higher treatment costs. Excess nutrients feed algae near the surface. When algae die, bacteria consume oxygen during decomposition. Fish may gather at the edges, gasping for air. Sometimes, there is no safe edge. NOAA’s 2024 Gulf of Mexico assessment measured a hypoxic zone covering 2,889 square miles. The agency linked this seasonal “dead zone” mainly to nutrient pollution from the Mississippi River Basin.
Nitrogen also changes aquatic chemistry in less visible ways. Dense algae can block sunlight, weakening submerged plants and reducing nursery habitat. Some cyanobacteria produce toxins that threaten pets, wildlife, and recreational users. The U.S. Environmental Protection Agency identifies nutrient pollution as one of the leading causes of impaired waters in the United States. Its Gulf strategy targets a 20% nitrogen-load reduction by 2025 and 45% by 2035. Progress remains uneven. Weather, soil drainage, and farm practices complicate the numbers.
Tips: Apply fertilizer after soil testing, not by habit. Keep applications away from heavy rain forecasts. Vegetated buffer strips can slow runoff. Cover crops help capture leftover nitrogen. Check drainage outlets after storms; clear water is not always clean. Field experience suggests timing matters, but no single practice works everywhere. Local soil data should challenge generic advice.
| No. | Water-Quality Effect | How Nitrogen Fertilizer Contributes | Typical Indicator or Benchmark | Potential Consequences | Risk Level |
|---|---|---|---|---|---|
| 1 | Nitrate leaching into groundwater | Nitrate is highly soluble and can move below the root zone when fertilizer application exceeds crop demand or rainfall is heavy. | 10 mg/L nitrate-nitrogen (NO₃-N) is the U.S. drinking-water maximum contaminant level; the WHO guideline is 50 mg/L as nitrate ion. | Contaminated wells, increased drinking-water treatment needs, and elevated health risks for infants. | High |
| 2 | Eutrophication of lakes and reservoirs | Runoff carries dissolved nitrogen and nitrogen attached to soil particles into freshwater systems, stimulating excessive plant and algae growth. | Total nitrogen targets are site-specific; nutrient criteria vary substantially by lake type, region, depth, and background conditions. | Reduced water clarity, nuisance vegetation, unpleasant odors, and loss of recreational value. | High |
| 3 | Toxic algal and cyanobacterial blooms | Excess nitrogen can support cyanobacteria and algae, particularly when phosphorus, sunlight, warm temperatures, and slow water movement are also present. | The U.S. recreational-water advisory level for microcystins is 6 µg/L for primary-contact recreation. | Toxins may harm people, pets, livestock, fish, and wildlife; blooms can also create taste and odor problems. | Very High |
| 4 | Oxygen depletion and hypoxia | When excess algae die, microorganisms decompose the organic matter and consume dissolved oxygen. | Dissolved oxygen below 2 mg/L is commonly described as hypoxic; many fish and aquatic invertebrates require substantially higher concentrations. | Fish kills, reduced growth, avoidance of habitat, and formation of oxygen-depleted bottom waters. | Very High |
| 5 | Ammonia toxicity to aquatic life | Ammonium-based fertilizers can increase ammonia concentrations after application, especially in poorly buffered or poorly drained waters. | The toxic un-ionized ammonia fraction increases as pH and temperature rise; aquatic criteria therefore depend on pH, temperature, and species. | Gill injury, impaired growth, reproductive effects, and mortality in sensitive fish and invertebrates. | High |
| 6 | Nitrite formation and toxicity | Nitrate can be reduced to nitrite under low-oxygen conditions, while nitrite may also enter water directly through fertilizer runoff and wastewater pathways. | The U.S. drinking-water limit is 1 mg/L as nitrite-nitrogen; toxicity to aquatic species varies with chloride concentration and species sensitivity. | Interference with oxygen transport in aquatic animals and increased stress in fish and invertebrates. | Moderate–High |
| 7 | Loss of aquatic biodiversity | Nutrient enrichment favors fast-growing algae and tolerant species, changing food webs and reducing habitat quality for sensitive organisms. | Common biological signals include declining sensitive macroinvertebrates, lower species richness, and increased dominance by tolerant species. | Reduced fish and invertebrate diversity, altered food chains, and long-term ecosystem instability. | Very High |
| 8 | Estuarine and coastal dead zones | River-borne nitrogen stimulates coastal algal production; decomposition and water-column stratification can then reduce oxygen near the seafloor. | Bottom-water dissolved oxygen below 2 mg/L is widely used as an indicator of hypoxia. | Shrimp, crabs, fish, shellfish, and other organisms may be forced to leave or may die from oxygen stress. | Very High |
| 9 | Acidification of soils and connected waters | Nitrification of ammonium fertilizer releases acidity; repeated applications can reduce soil alkalinity and increase acidic drainage where buffering is limited. | Effects depend on alkalinity and geology; declining pH and alkalinity are key warning indicators rather than universal fertilizer thresholds. | Stress to pH-sensitive aquatic organisms, increased metal mobility, and reduced survival of eggs and larvae. | Moderate |
| 10 | Higher drinking-water treatment costs | Nitrate, nitrite, ammonia, algae, and algal by-products can require additional monitoring and treatment when fertilizer losses reach source waters. | Nitrate above 10 mg/L as nitrogen exceeds the U.S. drinking-water limit; treatment requirements depend on the contaminant and water source. | Greater operational costs, more frequent treatment, possible drinking-water restrictions, and reduced public confidence. | High |
Note: Water-quality responses vary with fertilizer rate, soil type, rainfall, drainage, temperature, pH, alkalinity, waterbody depth, and the availability of phosphorus. Numerical benchmarks are not universal ecological thresholds and should be interpreted within local regulatory and monitoring programs.
Excess nitrogen fertilizer can move beyond crop roots and change water quality. Rain washes nitrate into ditches, streams, and reservoirs. Groundwater may carry it toward private wells. That risk is easy to miss.
Nitrate in drinking water can threaten infants, especially when water is used for formula. It can also increase treatment demands for community systems. Monitoring should combine field observations with laboratory testing.
Test wells, drainage outlets, and nearby surface water at different times. Sample after heavy rain and during dry periods. Use a certified laboratory when results guide health decisions. Keep records of dates, rainfall, fertilizer rates, and water depth. A single clean sample proves little.
Prevention begins with a soil test and a realistic crop nutrient plan. Apply smaller fertilizer amounts in split treatments. Avoid spreading before storms or on frozen, saturated ground. Cover crops can hold nitrogen between growing seasons. Vegetated strips near waterways slow runoff and trap sediment. Careful irrigation reduces deep drainage below the root zone. Farmers should inspect drainage paths after strong rainfall. Small changes matter.
Still, no method is perfect. Weather can defeat a well-designed plan. Monitoring results may also reflect older fertilizer applications. That uncertainty deserves attention, not false confidence.
Synthetic fertilizers may contain urea, ammonium, or nitrate. Manure, compost, and crop residues also release nitrogen.
Nitrate dissolves easily in water and moves downward through porous soil. Sandy fields and shallow water tables face higher risks.
Yes. A heavy spring storm may carry recently applied nitrate toward drainage tiles within hours.
Ammonium often binds to soil particles. Microbes can convert it into nitrate. Urea may release ammonia gas before entering soil.
Runoff carries dissolved nitrate and soil particles into ditches, streams, and reservoirs. Tile drainage may deliver nitrate directly to rivers.
Nitrogen feeds algae near the surface. When algae die, bacteria consume oxygen during decomposition. Fish may gather near shore, gasping.
Some cyanobacteria produce toxins that threaten pets, wildlife, and people using recreational water. Dense algae can also block sunlight.
Dissolved nitrate may be invisible. A clear outlet can still carry nitrogen after a storm. One sample can mislead.
Test soil before applying fertilizer. Avoid heavy rain forecasts. Use cover crops and vegetated buffer strips where suitable.
Combine soil tests, well checks, drainage monitoring, and rainfall records. Results remain imperfect because weather and soil conditions change.
Nitrogen fertilizer can improve crop growth, but its movement through soil and water systems may seriously affect water quality. It exists in forms such as nitrate, ammonium, and organic nitrogen, each of which behaves differently after application. Rainfall and irrigation can carry dissolved nitrate into groundwater, while surface runoff can transport nitrogen into rivers, lakes, and coastal waters. How does nitrogen fertilizer affect water quality? Excess nitrogen encourages rapid algal growth, leading to algal blooms and eutrophication. As algae die and decompose, oxygen levels decline, creating harmful conditions for fish, plants, and other aquatic organisms. Some algae may also produce substances that threaten wildlife and make water less suitable for recreation or drinking.
Protecting water supplies requires regular monitoring of nitrate levels, careful fertilizer timing, accurate application rates, buffer zones, cover crops, and improved soil management. These measures help keep nitrogen near plant roots, reduce losses, and prevent contamination before it reaches groundwater or surface waters.

Treo Nutrition